Video analysis of the dynamics of countries by GDP at purchasing power parity in 1991-2024
The visualization of the dynamics of the top 20 countries by GDP at purchasing power parity (PPP) in 1991-2024 that has spread on social media is, on the whole, confirmed by international statistics: in 2024 the world’s largest economies by GDP (PPP) are China, the US and India. According to World Bank data on the indicator GDP, PPP (current international $), in 2024 the GDP
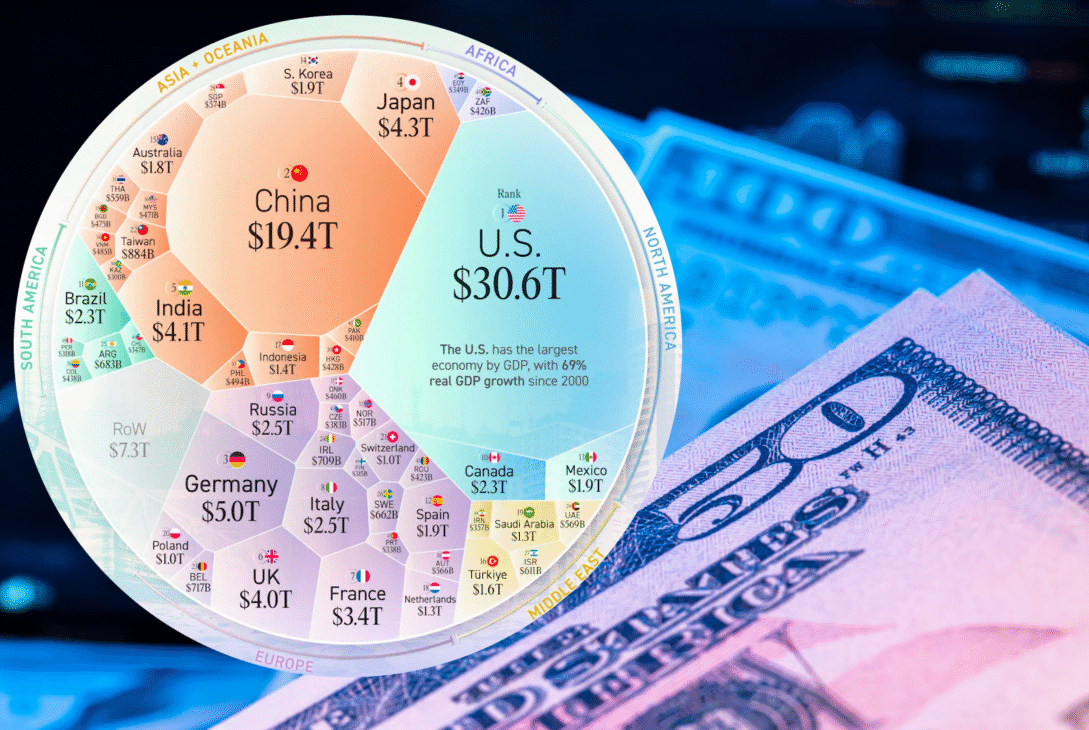
The visualization of the dynamics of the top 20 countries by GDP at purchasing power parity (PPP) in 1991-2024 that has spread on social media is, on the whole, confirmed by international statistics: in 2024 the world’s largest economies by GDP (PPP) are China, the US and India.
According to World Bank data on the indicator GDP, PPP (current international $), in 2024 China’s GDP at PPP was estimated at $38.19 trillion, the US’s at $29.18 trillion and India’s at $16.19 trillion. The top ten largest economies by this indicator also included Russia (4th place), Japan (5th place), followed by Germany, Indonesia, Brazil, France and the UK.
Experts Club notes that the “race” of 1991-2024 reflects a long-term shift of the weight of the world economy toward Asia. At the start of the period the leaders were advanced economies, but then markets with large populations and domestic demand grew rapidly, and China and India gradually established themselves in the leading group.
“GDP at PPP shows not ‘wealth in currency’ but the scale of an economy, taking into account how many goods and services can actually be bought within the country. That is why PPP better describes the domestic market and consumption potential, whereas for foreign trade, debts and capital inflows it is important to look in parallel at nominal indicators as well,” commented the founder of the Experts Club analytical center, Candidate of Economic Sciences Maksym Urakin.
The GDP at PPP indicator converts the size of an economy into “international dollars,” taking into account differences in price levels between countries, so that the comparison is more accurate than when converting at market exchange rates.
The video analysis by the Experts Club analytical center is available at the link –